How to use the built-in Windows packet capture tool directly on the command-line.
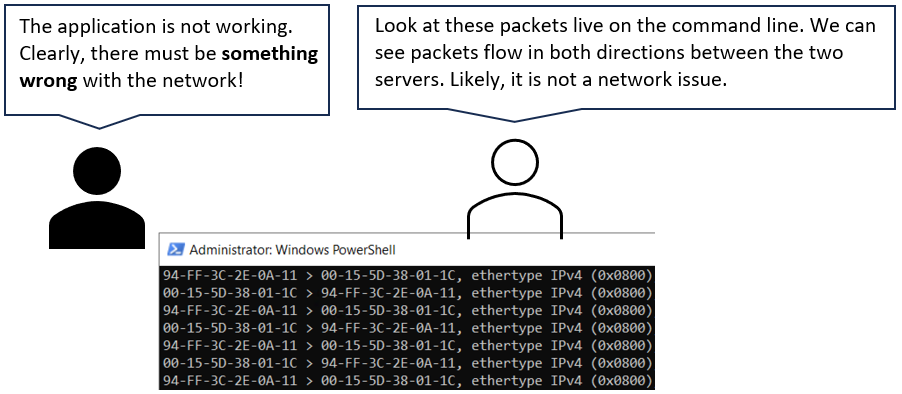
Often, in troubleshooting, it is a great asset to be able to display real-time network packets on the command line. Instead of guessing or trying to decode vague error messages in applications, an advanced administrator could prove that, e.g., two systems indeed have current traffic over an established TCP session on a particular port. Alternatively, being able to prove that two systems are not currently communicating at all on the network layer will provide invaluable information to the troubleshooting process.
Such actions are possible if a built-in command-line network sniffer is available.
TCPDUMP is a classic tool, originating from the ’80s, available on many Linux/Unix-like systems. With this tool, the administrator can see real-time traffic-flows on the command line. For many years, such a built-in option has been lacking in the Windows operating system family.
Now, such a tool is available in Windows Server 2019 and later operating systems. The native packet capture tool is called PKTMON.
To use PKTMON in the real-time mode, three prerequisites must be met:
1. Correct filters applied.
2. The internal ID number for the network interface card acquired.
3. Knowledge of the correct command-line parameters to start the capture.
Start an elevated Command Prompt or Powershell Window.
Before proceeding to conduct any packet capture, ensure you have a solid understanding of how to construct filters. Please see this article for all details.
Add the filters suitable for the upcoming capture.
Now, we must locate the “internal ID number” for the network adapter where the capture will be conducted. If omitting this step, we will experience multiple duplicates of each network packet captured.
This ID could be found by the command:
pktmon comp list
Make a note of the ID number to the left of your network adapter. This number can change between server reboots and is not guaranteed to be persistent.
Ensure not to use C:\Windows\System32 as the working directory in the Command Prompt / Powershell.
Temporary files will automatically be created. We should not insert those into the critical System32 folder.
Navigate to a suitable location in the filesystem, e.g., CD \tmp.
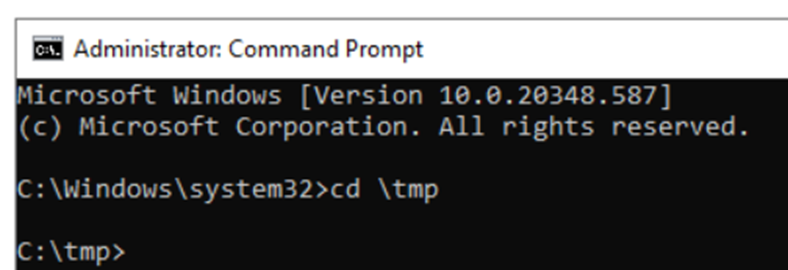
If no temporary folder exists, either create a new one or navigate to the system root. It is recommended to use a dedicated temporary folder.
Verify that the proper filters are loaded with the command pktmon filter list.
Ensure that the Command Prompt window is as wide as possible. If the tool is forced to line-break the output, the results will be more challenging to interpret.
Now start the real-time packet capturing on the command line with the following syntax:
pktmon start -c -m rt -s 16 --comp <YOUR ID-NUMBER>(Note the double hyphens in front of comp.)
The ID number at the end of the line is the number acquired in the previous point, by using the command pktmon comp list.
For example:
pktmon start -c -m rt -s 16 --comp 18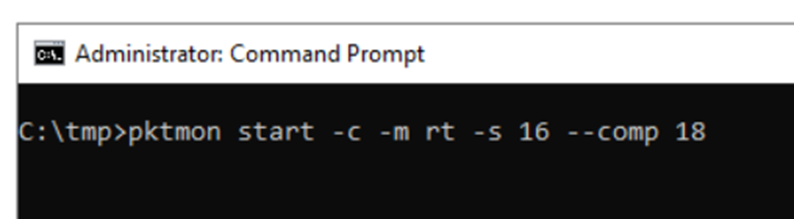
If the output states that pktmon is already running, first use: pktmon stop
Use CTRL + C to stop the capture at any moment.
Explanation of the syntax for the command line:

-c Enables capturing of packets.
-m rt Sets the capture mode to real-time.
-s 16 A log file will always be created. 16 MB is the minimum size. If omitting this parameter, a log file of 512 MB will be created, consuming unnecessary server disk space.
––comp The “component ID”, i.e., the internal number of the network interface. This ID can be acquired by the command “pktmon comp list”.
Note that the comp parameter has two minus symbols in front.
Explanation of the output data:

Whenever using PKTMON in real-time mode, ensure to have a very wide Command window.
Every captured frame consists of two lines of output data.

The first line gives general information about the packet, while the second line will include details of the packet content.
In the article “PKTMON part 10: Advanced troubleshooting in real-time mode“, more information is presented on how to read and analyze the content of the output lines.
Overview of the information:
Line 1:

Timestamp, at the leftmost edge.

Traffic direction, from the perspective of the local NIC. This value will be “RX” for receive, i.e., incoming frames, or “TX” for transmit, i.e., frames sent from the local NIC to the outside network.

The “Originalsize” field will display the size of the full frame, including all the headers. Note that the last four bytes of the frame, the FCS field, have already been removed by the network card. The true size of this frame was 1518 bytes.
Line 2:

The leftmost entry on line 2 is the source MAC address. If the traffic direction is TX, this should be the server’s own MAC address. If the direction is RX, this is the layer two source address on the local LAN segment.

The next field on line 2 is the target MAC address. If the direction is RX, the address could be the server NIC’s address, or a multicast or broadcast address. If the direction is outgoing, i.e., TX, the address could be the MAC address of another server on the same segment. If the packet is destinated to a device outside the local LAN segment, i.e., to any other device in the world, the destination address will be the layer two address of the router’s interface, i.e., your “default gateway.”

The next field to discuss is the source IP address. Depending on if the traffic direction is TX or RX, this is either your own IP address sending to another source, or the destination server replying to you.
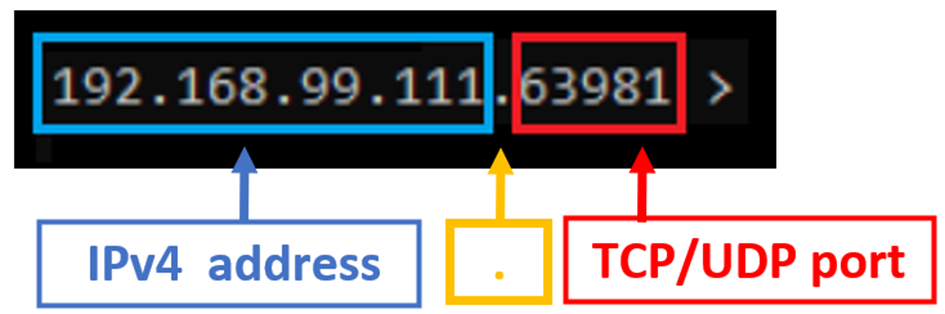
Note that an archaic format is used to specify the IP address and the TCP/UDP port. Today’s most commonly used format is the IP address and the port separated with the colon sign, as in 192.168.99.11:63981. However, PKTMON instead uses the legacy format of IPaddress.port, e.g., 192.168.99.11.63981.
Just be aware of this slightly uncommon format of the dot as the separator between IP address and port number.

Destination IP address and TCP or UDP port. Depending on the direction, the IP address and port are either the client or the server side. Note that the dot is the separator between the address and port also on the destination.
If the traffic is TCP-based, we will see the Flags field, specifying the TCP flags enabled on the packet.
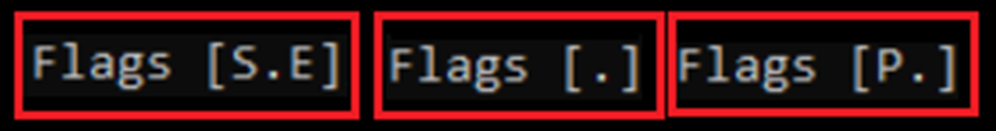
(Three examples of TCP flags in three different packets.)
The flags will be presented as the first letter of the flag name, with the exception of the Acknowledgement flag, which will be displayed only as a dot. Note that the acknowledgment flag will be set on every single TCP packet during an entire TCP session, except for the very first SYN packet.
A summary of article two and three is available here: