Tcpdump-uw is a command line packet sniffer available in ESXi. Learn the most useful parameters to troubleshoot ESXi networking.
A very valuable help in all network troubleshooting is the ability to actually look at the packets being sent and received. ESXi includes the tcpdump-uw packet sniffer tool to verify and troubleshoot vmkernel network traffic.
In this blog post we shall see how to study and troubleshoot the vmkernel network traffic with tcpdump-uw. It is also possible to access the traffic from the virtual machines with some additional configuration, but there are other more effective tools for VM network analyze which will not be discussed here.
The tcpdump-uw tool has many parameters and could initially be seen as somewhat hard to understand and use, but this blog post will explain all the command line parameters above and show when they are useful.
We shall also note that while tcpdump-uw could be used to really analyze the content of the packets, the major advantage of the tool is to verify that there in fact is traffic going on e.g. a certain interface to a certain server on a certain TCP port. If we really want to in depth analyze all fields in e.g. the TCP header and applications above there are more suitable tools, however to just observe that traffic does come, or perhaps even more important, to see that no traffic is coming is extremely useful in troubleshooting.
To use tcpdump-uw you must access the ESXi Shell, either directly at the console or through SSH. Since the tcpdump-uw output typically overflows a single console line a SSH session is very recommended if that option is available.
Before starting the network capture be sure that the SSH client window, for example Putty, is as large as possible, especially the window width. We would like the output to fit on a single line, so extend the window as much as possible.
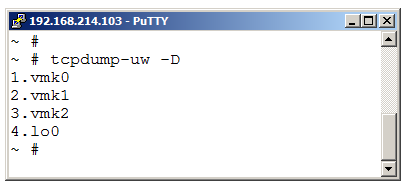
Next step is to select which VMkernel adapter we would like to “listen” on. To display the list of available adapters use:
tcpdump-uw -D
(Note that all parameters are case sensitive.)
We see that in this example host we have three VMkernel adapters available.
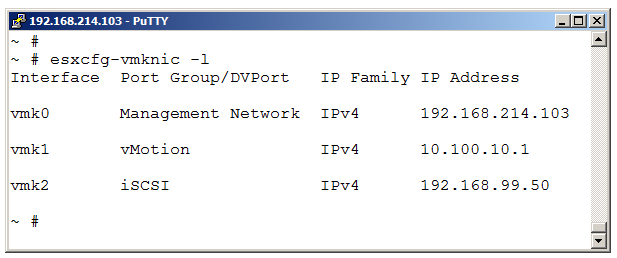
If needed, use esxcfg-vmknic -l to see the logical names of the VMK adapters.
To begin a listen session on one VMkernel interface use the -i (interface) switch on tcpdump-uw and set the adapter interface number from the -D output.
tcpdump-uw -i 3
You should however always use two other options as well.
-n = Make no attempt to resolve IP addresses to DNS names or TCP port numbers to names. Without this option the network output could be very slow and the “friendly” naming of TCP or UDP ports is often, in my opinion, harder to read than just the real port numbers.
-s0 = Collect the whole packet. Even if we typically do not need more than just the initial headers when troubleshooting with tcpdump-uw in ESXi, there will be some extra output indicating lines similar to: “IP truncated-ip – 18 bytes missing!“, which is confusing and makes the output more difficult to interpret. With the -s0 parameters these warnings are not displayed.
So a minimal line should look like:
tcpdump-uw -i INTERFACE-NUMBER -n -s0
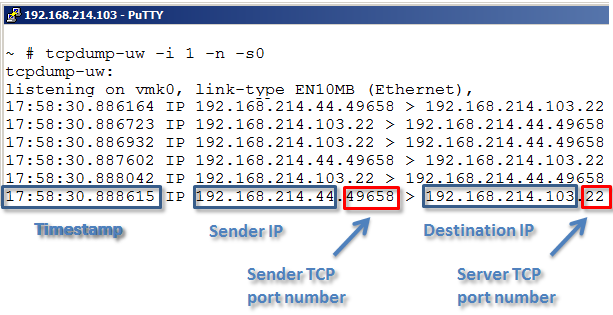
The output given by default a timestamp first on the line and then IP and TCP information.
The way tcpdump-uw (and tcpdump/windump as well) uses to display a IP address and TCP port number is somewhat unusual. A common way is to separate the IP address and the TCP port with a colon, for example 192.168.213.100:80, however tcpdump-uw uses a dot as punctuation, like 192.168.213.100.80.
You could always abort the tcpdump-uw packet monitoring with CTRL + C.
If listening on the same interface as the management traffic and/or SSH packets enter the host the tcpdump-uw output could be somewhat overwhelmed with the amount of SSL and SSH data. With a simple capture filter we could ask to not display certain protocols.
To display all traffic on a VMkernel interface but not SSH use:
tcpdump-uw -i 1 -n -s0 not tcp port 22
If seeing large amounts of Management traffic just add:
tcpdump-uw -i 1 -n -s0 not tcp port 22 or tcp port 443
Next thing to consider is if the time information is useful at the moment or not. By default a timestamp is displayed at every line and there are situations where the time a packet arrived or the amount of time that elapsed between two packets are most important.
There could also be situations where the exact time is not interesting and the written timestamp only makes that output harder to read. The -t options tells ESXi to not display the time information.
The tcpdump-uw utility exposed by default also some information about the TCP headers, as in some simple information about TCP flag states (for example S = syn, P = push, F = finish, R = reset) and also displays the TCP sequence numbers and TCP windows size.
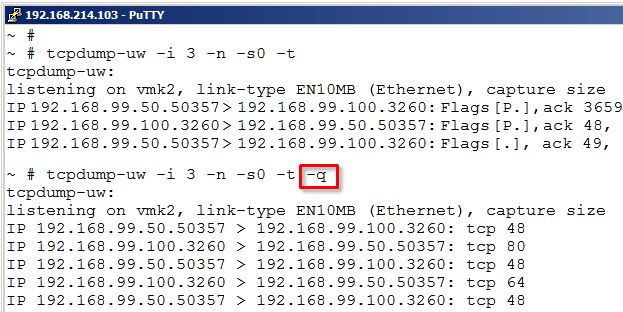
That information could also at times be very useful, but in other situations increases the output length in such way that it makes it harder to study. With the -q (quick) option we can instruct tcpdump-uw to skip almost all TCP information. Note that the TCP client and server port numbers are always visible.
tcpdump-uw -i 1 -n -s0 -t -q
The quick parameter makes the output quite clean and often more easy to read, but to the price of some information left out, as seen above.
Something that by default is not displayed but could be at times be useful is to see the layer two MAC addresses for the sender and destination network adapters.
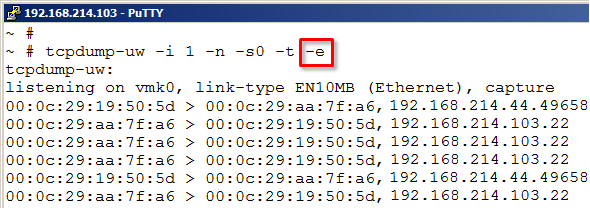
tcpdump-uw -i 1 -n -s0 -t -e
With the -e option we could see the MAC addresses involved for each frame. We still see the IP addresses and TCP ports on each line.
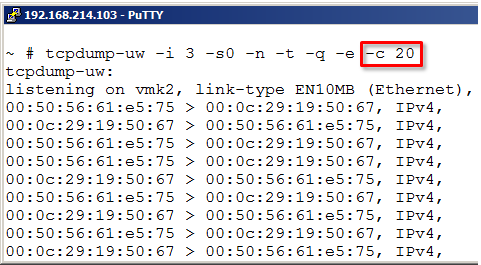
Normally the tcpdump-uw runs for ever or until the user aborts the command through CTRL + C. If wanted we could instruct the tool to just collect a certain number of packages and then automatically quit.
Use the -c (count) and the number of frames wanted.
The final information needed for the administrator to use tcpdump-uw is how to create some simple traffic capture filter, that is, how to define what network packets to capture and display. A common mistake with all kind of network analyzers is often to just start them up and get overwhelmed by the extreme amount of different kind of packets and then give up.
By specifying a filter we will reduce the amount of displayed traffic types a lot. The filter is placed on the end of the command line.
For example, assume that tcpdump-uw displays a lot of frames from for example Spanning Tree, LLDP, LACP, DHCP broadcasts and similar, all very useful, but will make the tcpdump-uw output more difficult to see.
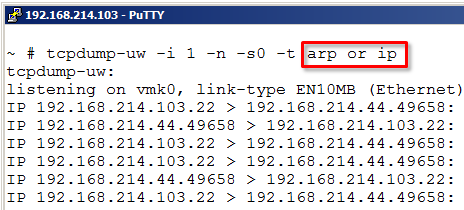
One example of a filter could be just “ip“. This will remove for example all Spanning Tree frames from the output. Another example could be to just write “arp“, if we only want to study ARP request and replies.
These could also be combined, for example with “arp or ip“.
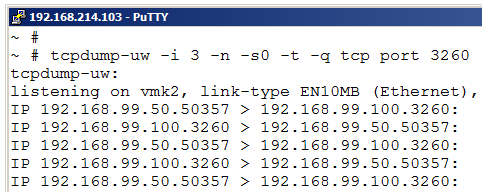
If the “ip” specifier collects too much traffic we could use a certain TCP port number. For example above, we want to see only iSCSI traffic (TCP/3260) and could use the command line:
tcpdump-uw -i 3 -n -s0 -t tcp port 3260
If having a iSCSI multipath configuration make sure to test all vmkernel adapters on the iSCSI network to actually see that the traffic is flowing on all expected interfaces. Use the -i option to look at every iSCSI vmkernel adapter each at the time.
If we have multiple iSCSI targets and want to see if we have traffic to a specific target IP we could combine a TCP port number and a IP destination host with:
“tcp port X and ip host Y” – for example: “tcp port 3260 and ip host 192.168.99.100”
Note that the AND option above specifies that both statements must be true, that is traffic to or from the specific IP address and a certain TCP port. If we change the AND to OR we would display traffic that either are iSCSI (tcp/3260) or involves the IP address.
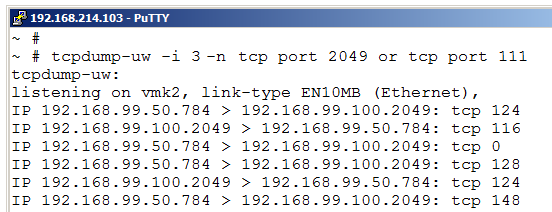
If troubleshooting NFS the tcpdump-uw tool could also be very useful. We might want to see if the host has access to the NFS server at all or maybe want to verify that traffic is actually going over all interfaces. Setting up “multipath” for NFS involves some advanced configuration with multiple VMK adapters and IP addresses and having correct binding of the VMKs to the vSwitches and vmnics.
With tcpdump-uw we could really see if we use all interfaces and also if we do access the different NFS server IP addresses on the interfaces we intend.
For NFS use a filter like “tcp port 2049 or tcp port 111“. Make sure to also test all interfaces with -i.
A final example is that we could also study UDP traffic with tcpdump-uw. Let us say we have problems with our time synchronization on an ESXi host. By observing the NTP traffic we might get a clue why the time is not set right.
With the filter “udp port 123” we instruct the ESXi host to only display NTP traffic. As seen above the host sends several NTP queries with about 1 minute delay, but does not get any response at all. Perhaps a firewall is blocking the NTP traffic, perhaps the NTP address in the ESXi host is incorrect?
Tcpdump-uw is like their counterparts tcpdump and windump a very useful tool to see what traffic is sent and received and also what traffic is not seen at all. The filter function makes the output more relevant and the different command line parameters could also remove some output information not always needed.
If you have any questions or comments on the tcpdump-uw tool use the comment field below.






Very nice article! I had to troubleshoot NTP, and this post explained everything that i need to know in order to do that. Thanks Rickard!
Nice to hear that Greg, glad to be able to help.
Regards, Rickard
Hi Rickard,
very good post, saved me a lot of time 🙂
Thanks for your work and for sharing this!
regards
Hardy
Thank you. 🙂
Excellent and complete information for complex and confusing network troubleshooting.
This is good for learning new network acquisition method thank you. but I have doubt on tcpdump how to install esxi server.
Great article Rick, thanks for share this great info