How to use Task Manager in Windows Server 2008 R2 and Windows 7 to interpret actual memory usage.
The easiest and fastest way to check CPU and Memory usage of a Windows Server is often to use Task Manager, however the data given in the tool is not so obvious as it may look. Task Manager is an old tool that has been available since at least Windows NT 3.51 and has been somewhat modified in each Windows Server release since, however rarely completely understood.
(The best way to start Task Manager is the press CTRL SHIFT ESCAPE at the same time. This may seem stupid, but they are all located on left side of the keyboard and can be touched together with one hand.)
In a series of posts I will discuss how to read and understand the memory output of Task Manager in the most common Windows operating systems. Unfortunately many of the values have very different names and meaning between the OS generations, which I will cover.
The whole concept of Memory Management is very interesting and will also be explained in more detail in another post, but here we will just assume that we have some amount of physical RAM and some swap space located on the hard drive. This swap file is always, as you probably know, called “pagefile.sys“.
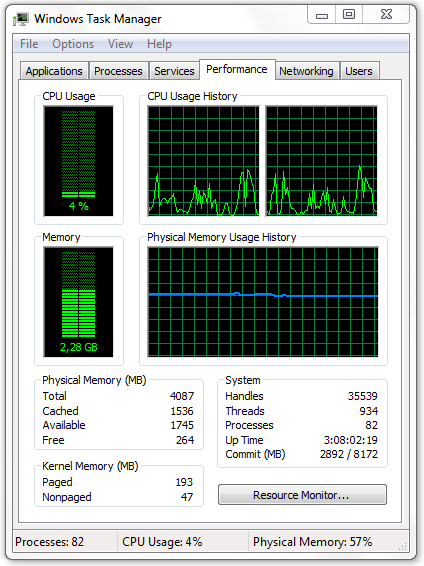
We will begin with Windows Server 2008 R2 and Windows 7. Here is a screen shot of Task Manager (taskmgr) started and the performance tab selected.
Let us now break down the interesting parts of these.
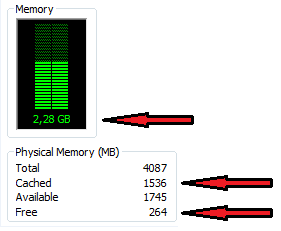
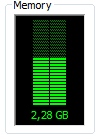 The graphical view has changed a lot from earlier versions of Windows. The total height of this counter now represents only the physical memory installed in the server, in this case 4 GB. Note that the bar does not include any space in the swap file, which earlier Windows version displayed here together with physical RAM usage.
The height of the green bar does not really show the total amount of RAM being used at the moment, but it will tell how much all processes consume, excluding areas for file system cache.
In this example, we have processes in 2,28 GB of physical memory, but we do not know how much memory the whole operating system consumes – which could for example be very important in a virtualization environment.
Looking at the numbers below we see four values.
Here is the first simple formula:
Total – Free = Total amount of consumed RAM
4087 – 264 = 3823 MB, which is about 3,8 GB. Note that this is very different from the value in the green bar above which displays 2,2 GB. This value of total consumed RAM is not shown anywhere in Taskmgr and has to be calculated this way. If this was a virtual machine it would demand 3,8 GB of physical host memory.
We must also be aware that we do not see how much of the memory pages that already might have been swapped to the pagefile. We will later in the article see how to observe the page file usage.
Note also that the percentage shown in the right bottom corner of Task Manager does not give the total actual physical memory usage, it is the same as the green bar.
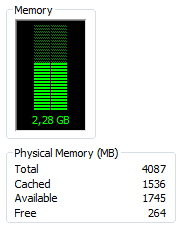
There is some potential confusion with the rest of the values, as they do not really seem to add up together correctly. If we look at the picture to the left we have 2,28 GB of process memory, then 1536 MB of cached memory and still 1745 MB available – out of 4 GB physical RAM? That will not make any real sense. However, if we just know how to read these it is quite logical.
Windows 2008 R2 will try to aggressive use most of the physical memory not demanded by processes for caching purposes – which is a good thing, since memory installed in the server is wasted if not used. (If we do run the Windows 2008 R2 in a virtual machine it could in some situations be wise to lower the amount of RAM given to it.)
The amount of physical memory used for caching purposes at the moment is shown as Cached, here 1536 MB. These Cached MB is not included in the green graphic bar above, but still is in physical RAM.
Next formula:
Value on green graphic bar + Cached + Free = Total amount of RAM
2280 MB + 1536 MB + 264 MB = 4080 MB of physical RAM
This shows that this server at the moment is running processes together consuming 2,2 GB of RAM, the OS cache uses 1,5 GB of RAM and totally free is just 264 MB.
And where does the last value of “Available” come in? We have a whole 1745 MB that does not really seems to fit in the physical memory. The reason for this counter is primarily to show the user / administrator that there is some space that could in fact be used to run more processes and that we shall not fear a low “Free” number. There is two ways to calculate this:
Total amount of physical memory – Value shown on green graph = Available
or
Cached + Free = Available
Available is the amount of memory that the operating system could give away to processes if they need it, but while there is no demand it is either unused (“Free”) or used as caching space (“Cached”).
So to sum up the values:
Green graphic bar: physical memory used by processes
Total: the total amount of physical memory installed
Free: memory not used at all, should be low
Cached: how much is used by the operating system cache
Available: how much could be used by processes (either already free or can be reclaimed from cache)
What does all this mean for the Administrator then? Well, the most important counters or values to observe is these three:
- The green graphic bar and make sure it reasonable represent the applications being run together with the operating system processes, device drivers and services.
- The amount of Available, which shows if you have some working space left for the processes to increase in memory usage or to start more programs/services. This should generally not be too low.
- The VMware administrator should also look at Total – Free, since this will be the amount of RAM consumed by the virtual machine (from the VMs perspective). Just looking at the green memory bar in Taskmgr will not give the correct information. Since the Windows 2008 R2 server will allocate almost all memory it will get to use as cache, so a careful decision will be needed: more VM RAM means better I/O performance due to lower demands at storage access, but will also consume more host physical memory.
One more question: can we see from this view if the pagefile is in use and if so how much? That is, do we use the swap file or not? No, we can not, but with some extra work this information could also be gathered.
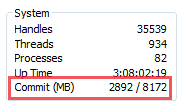
Look at the value “Commit (MB)” in Task Manager above. Ignore the first value, which does not show the paging file usage (even if some sources claim that). Note however the second value and subtract the amount of Physical Memory from this value.
Example: 8172 – 4087 = 4085, which will be about the size of the paging file.
Then start the Performance Monitor tool, by typing “perfmon” in the RUN field and add a new counter by clicking the green plus symbol, shown below.
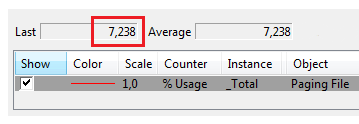
Add the counter Paging File / %Usage / _Total as shown above.
Then observe the Last Value which shows the paging file usage in %. Here we can see that the usage is 7,2% and when we already knew that the pagefile is 4085 MB in size we can use a final formula:
(Pagefile Usage Value / 100) * Pagefile Size = MB used in swap file
0,072 * 4085 = 294 MB in swap file
Please add any questions or comments on this post about Windows 2008 R2 Task Manager memory information.





Super, best explanation I ever seen.
excellent post!
how does the commit charge counter tie into this? Its a similar amount to the ‘memory’ graph but its value is slightly different
Great post. Thank you. Would like a similar one about the same page of the Task Manager on Windows XP, but this one have already helped me to understand it better.
The numbers of the XP’s Task Manager I would like to understand are at 3 rectangular areas the bottom of this same page, mainly at the ‘Memory used by the core’ area.
Thank you very much, with or without these other explanations.
Rob and Canbeiro, thanks a lot for your comments. I am planning a follow-up on this blog post with the commit charge and also a look at what is different in Windows XP / Server 2003.
Thanks a lot man… Great post.
Nice post Rickard,
appreciate your effort and sharing.
Is this calculation similar on Windows 2008 Sp2?
Thanks for commenting. The calculation are very similiar on Windows 2008, but I do think some of the counters have slightly different names.
Thanks,
really very nice article.
Good article…
Thanks for the neat formulae. I still have a question, however… At the moment my VM’s taskmgr says that 92% of Physical Memory is used (and Cached / Available values are low enough to provide support for that percentage), but the usage according to the processes tab doesn’t add up even to half that… Neither Working Sets nor Commit Sizes show any misbehaving app, so i’m looking for ideas on identifying the problem. :-s
Cool info on Windows memory,
thanks a lot for this useful stuff!!
Regards, Francois
Most useful information. I always wanted to know how to read and interpret these numbers, and I think I do so now. Thanks very much for the info.
The best explanation I’ve seen ever, thank you for the sharing, respect.
Thanks for this clear explanation.
I am in the middle of tuning up some terminal servers, and this is going to help me a lot.
Great, Thanx for your post, I will share this post with my blog.
Very good article, the explanation is very useful !!!!!